Popularity Velocity
Drawing how fast a library book rises and falls, not just how often it was borrowed
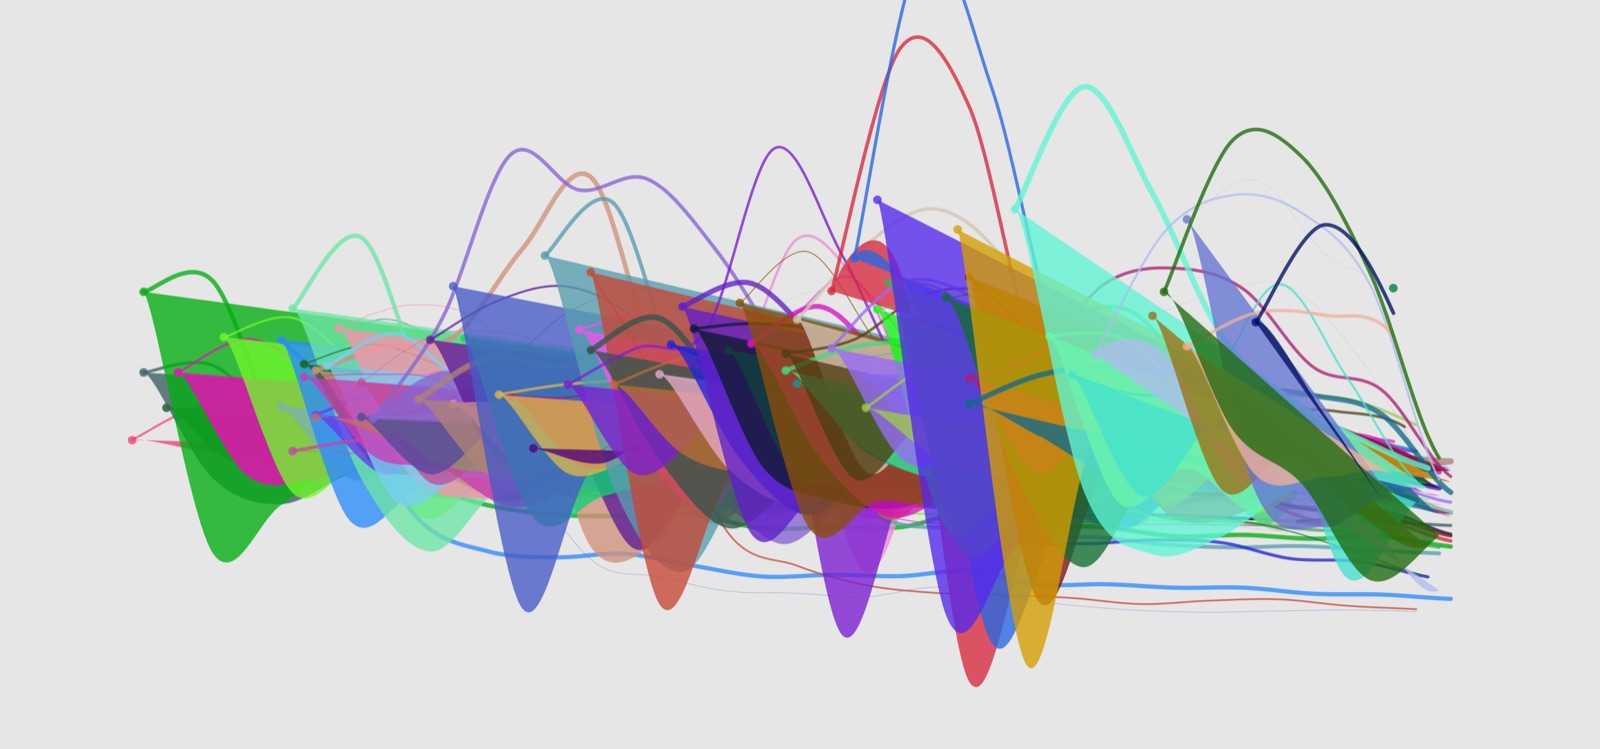
A checkout count tells you a title was popular. It does not tell you whether that popularity arrived overnight and drained away, or crept up over a decade. This study takes the top hundred most-borrowed items and plots the rate of change — the velocity of popularity — instead of the count.
Each item gets a curve. Where the curve spikes, a title caught on; where it folds back on itself, interest collapsed as fast as it came.

Splitting by medium turns it into a comparison. Books, CDs, and DVDs each have a different signature — how sharply a thing peaks depends on what kind of thing it is.


The filled version overlays the velocity curve on the raw popularity, so the two readings sit on top of each other: the outline is how many, the fill is how fast.